Gold Street Bridge Tide Chart for (Thu) February 1, 2024
Gold Street Bridge
tides for Feb 1st,
the sunrise is 7:11am-5:31pm
and the tide times are H 4:43am 8'10" L 12:31pm 1'8" H 5:04pm 6'1" L 11:34pm 2'1" .
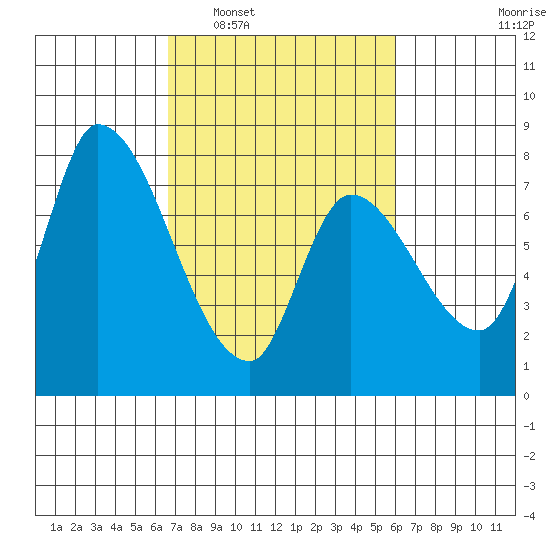
Gold Street Bridge Tide Chart for (Fri) February 2, 2024
Gold Street Bridge
tides for Feb 2nd,
the sunrise is 7:10am-5:32pm
and the tide times are H 5:20am 9'0" L 1:36pm 1'4" H 6:49pm 5'7" .
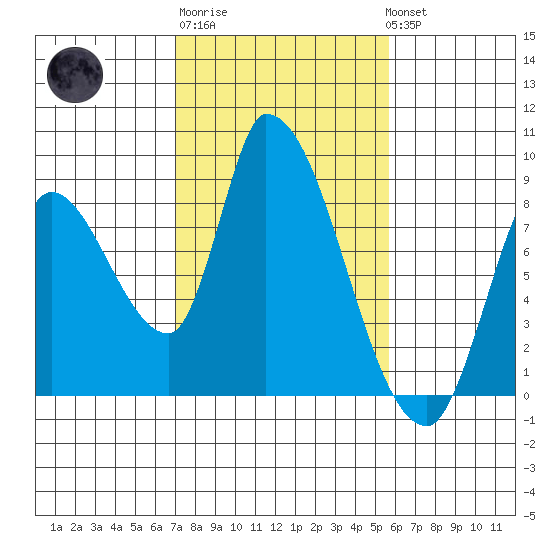
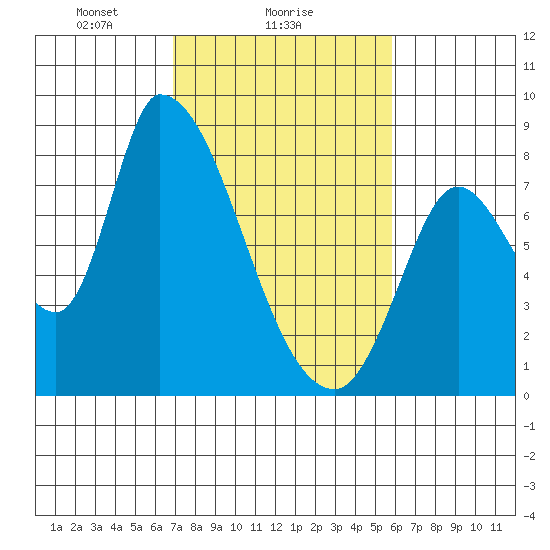
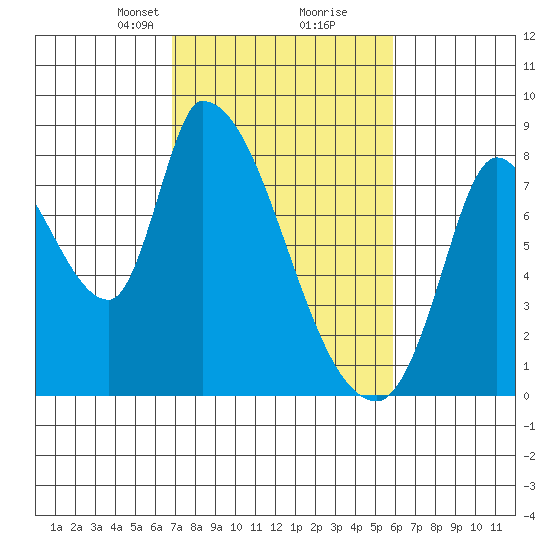
Gold Street Bridge Tide Chart for (Sat) February 3, 2024
Gold Street Bridge
tides for Feb 3rd,
the sunrise is 7:09am-5:34pm
and the tide times are L 12:19am 2'8" H 6:04am 9'3" L 2:41pm 0'10" H 8:56pm 5'10" .
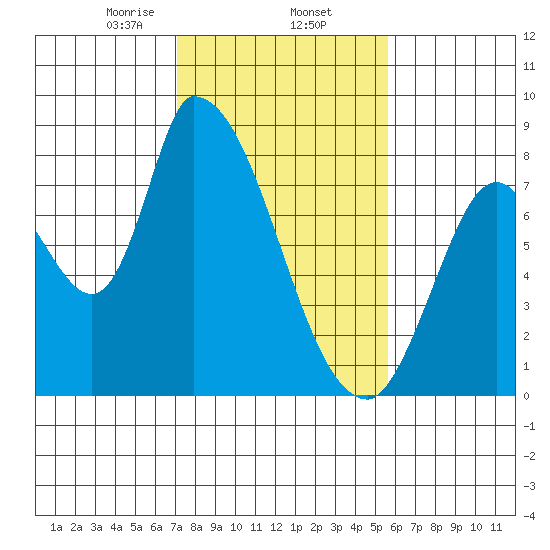
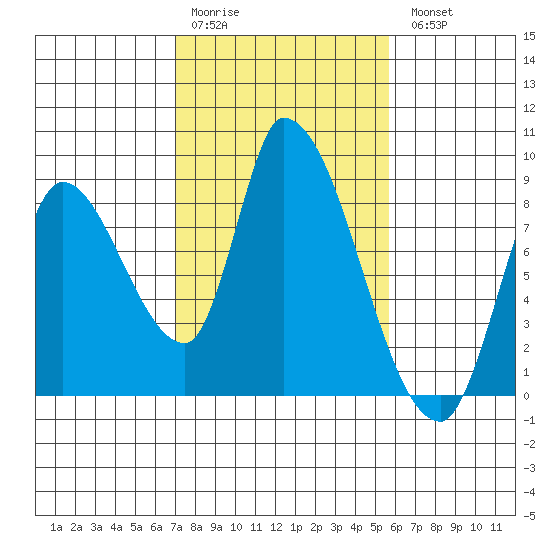
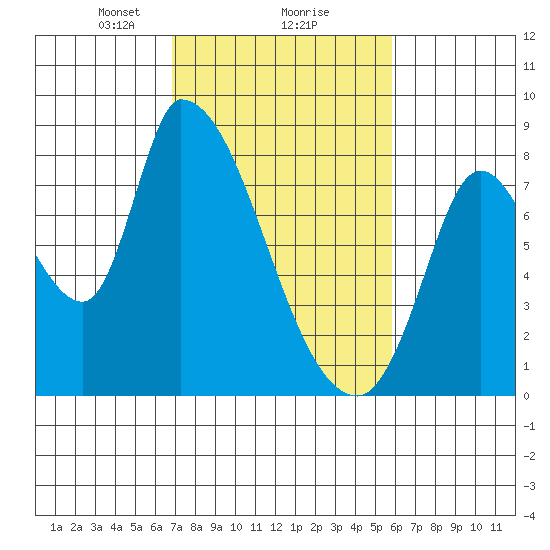
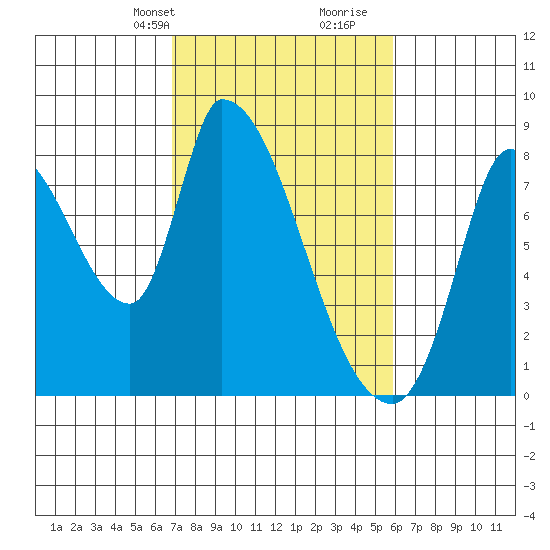
Gold Street Bridge Tide Chart for (Sun) February 4, 2024
Gold Street Bridge
tides for Feb 4th,
the sunrise is 7:08am-5:35pm
and the tide times are L 1:26am 3'1" H 6:56am 9'6" L 3:42pm 0'4" H 10:16pm 6'5" .
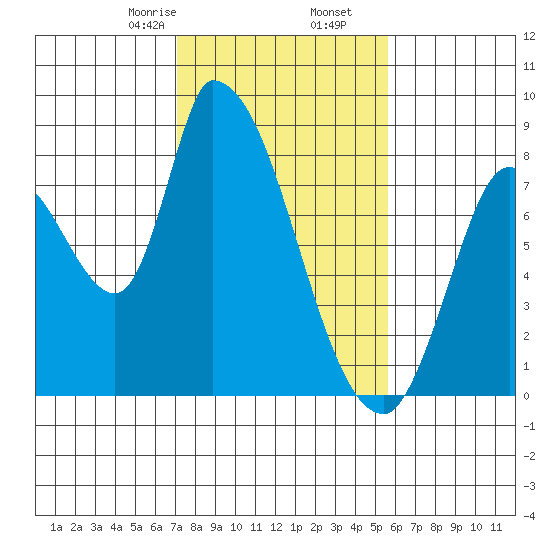
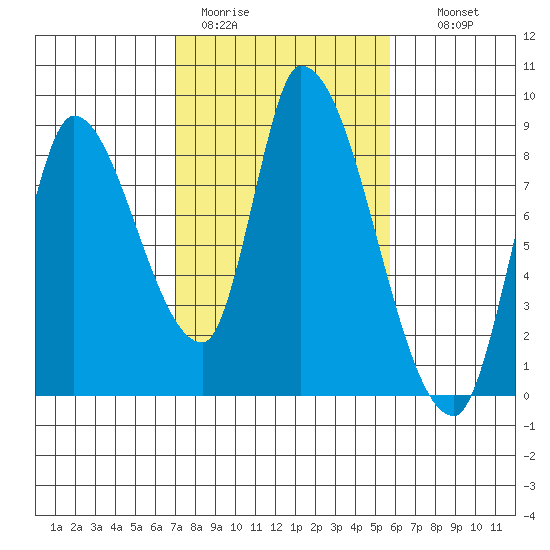
Gold Street Bridge Tide Chart for (Mon) February 5, 2024
Gold Street Bridge
tides for Feb 5th,
the sunrise is 7:07am-5:36pm
and the tide times are L 2:47am 3'4" H 7:53am 9'11" L 4:36pm -0'1" H 11:03pm 7'0" .
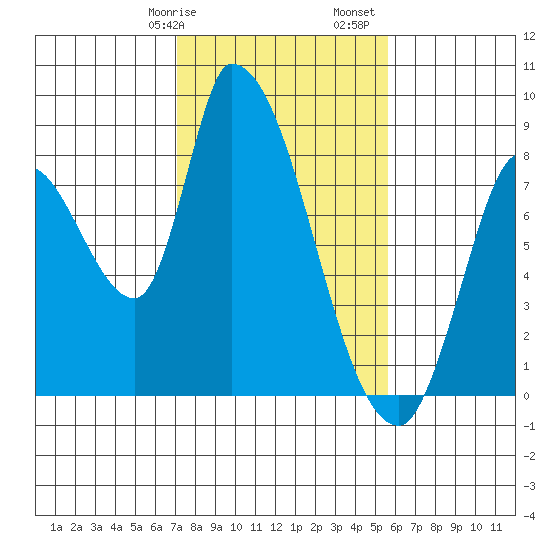
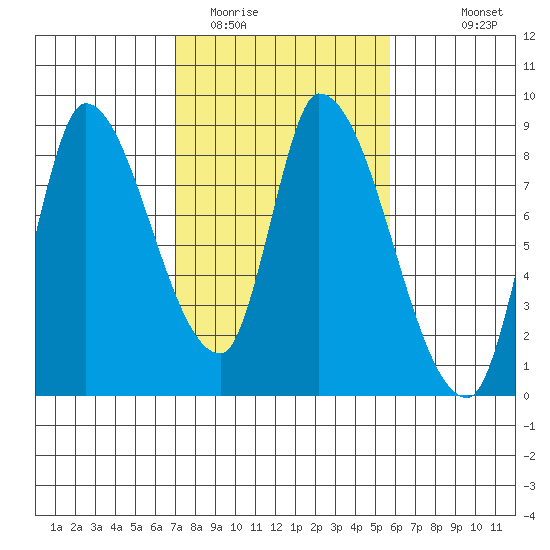
Gold Street Bridge Tide Chart for (Tue) February 6, 2024
Gold Street Bridge
tides for Feb 6th,
the sunrise is 7:06am-5:37pm
and the tide times are L 3:58am 3'4" H 8:50am 10'5" L 5:25pm -0'7" H 11:40pm 7'6" .
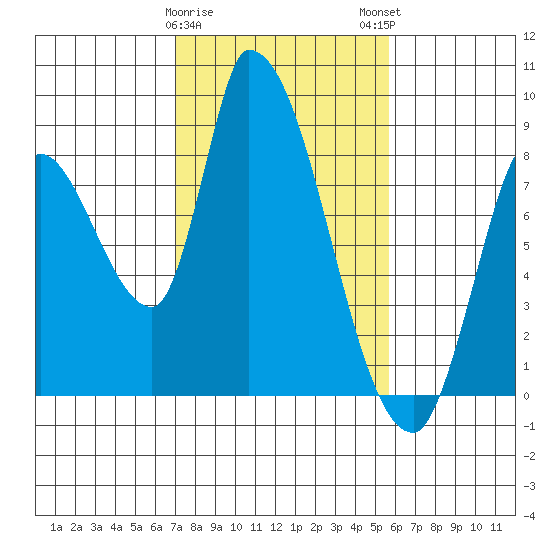
Gold Street Bridge Tide Chart for (Wed) February 7, 2024
Gold Street Bridge
tides for Feb 7th,
the sunrise is 7:06am-5:38pm
and the tide times are L 4:56am 3'2" H 9:46am 11'0" L 6:10pm -1'0" .
Gold Street Bridge Tide Chart for (Thu) February 8, 2024
Gold Street Bridge
tides for Feb 8th,
the sunrise is 7:05am-5:39pm
and the tide times are H 12:14am 8'0" L 5:48am 2'11" H 10:39am 11'5" L 6:53pm -1'2" .
Gold Street Bridge Tide Chart for (Fri) February 9, 2024
Gold Street Bridge
tides for Feb 9th,
the sunrise is 7:03am-5:40pm
and the tide times are H 12:47am 8'5" L 6:38am 2'6" H 11:31am 11'8" L 7:34pm -1'3" .
Gold Street Bridge Tide Chart for (Sat) February 10, 2024
Gold Street Bridge
tides for Feb 10th,
the sunrise is 7:02am-5:41pm
and the tide times are H 1:21am 8'10" L 7:28am 2'1" H 12:22pm 11'6" L 8:15pm -1'1" .
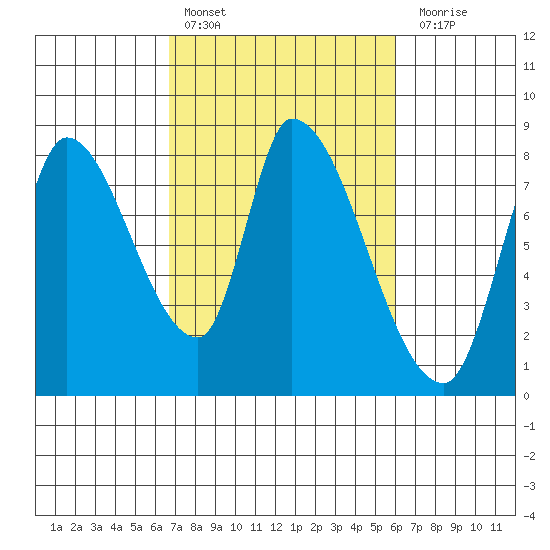
Gold Street Bridge Tide Chart for (Sun) February 11, 2024
Gold Street Bridge
tides for Feb 11th,
the sunrise is 7:01am-5:42pm
and the tide times are H 1:55am 9'3" L 8:20am 1'8" H 1:14pm 10'11" L 8:55pm -0'8" .
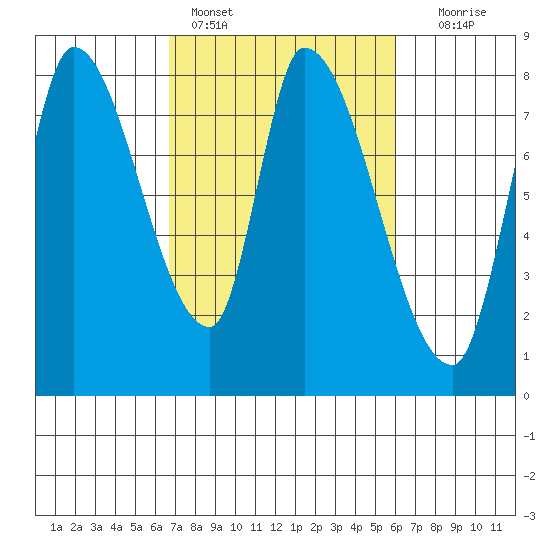
Gold Street Bridge Tide Chart for (Mon) February 12, 2024
Gold Street Bridge
tides for Feb 12th,
the sunrise is 7:00am-5:43pm
and the tide times are H 2:30am 9'8" L 9:15am 1'4" H 2:09pm 10'0" L 9:35pm -0'1" .
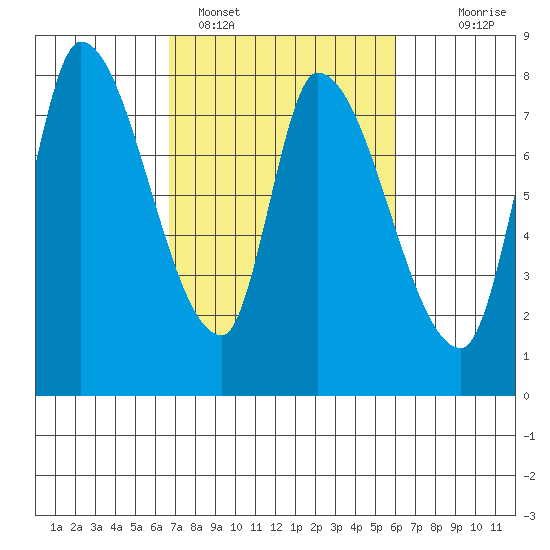
Gold Street Bridge Tide Chart for (Tue) February 13, 2024
Gold Street Bridge
tides for Feb 13th,
the sunrise is 6:59am-5:44pm
and the tide times are H 3:06am 10'0" L 10:13am 1'0" H 3:10pm 8'10" L 10:17pm 0'7" .
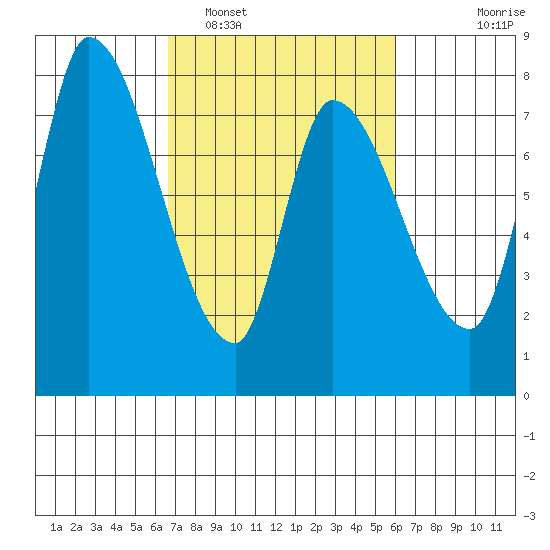
Gold Street Bridge Tide Chart for (Wed) February 14, 2024
Gold Street Bridge
tides for Feb 14th,
the sunrise is 6:58am-5:45pm
and the tide times are H 3:45am 10'3" L 11:17am 0'9" H 4:20pm 7'8" L 11:02pm 1'4" .
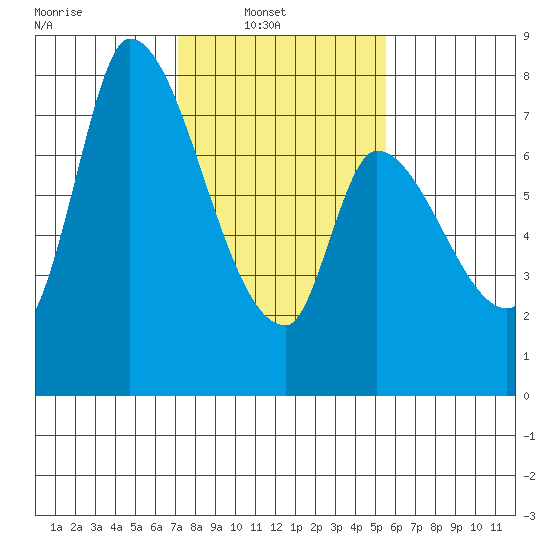
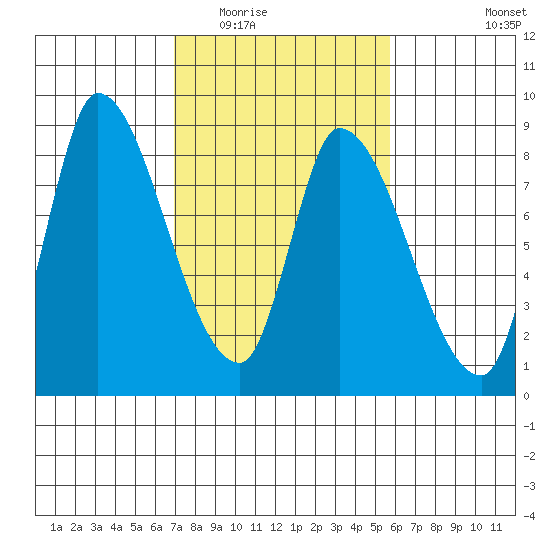
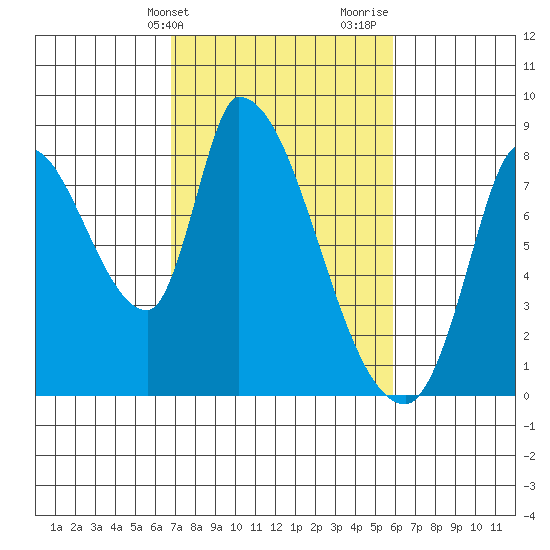
Gold Street Bridge Tide Chart for (Thu) February 15, 2024
Gold Street Bridge
tides for Feb 15th,
the sunrise is 6:57am-5:47pm
and the tide times are H 4:28am 10'3" L 12:27pm 0'7" H 5:48pm 6'10" L 11:55pm 2'1" .
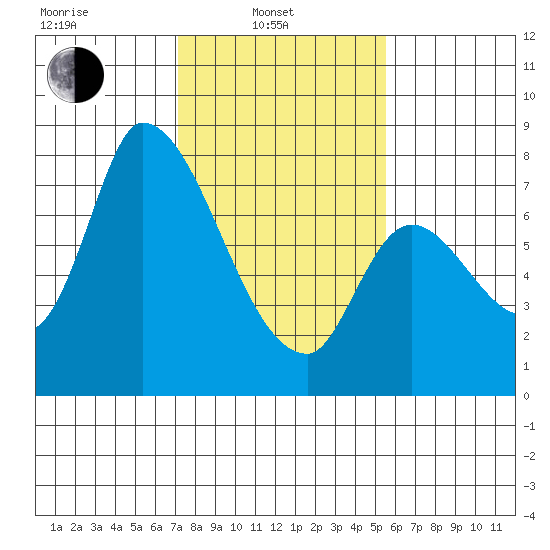
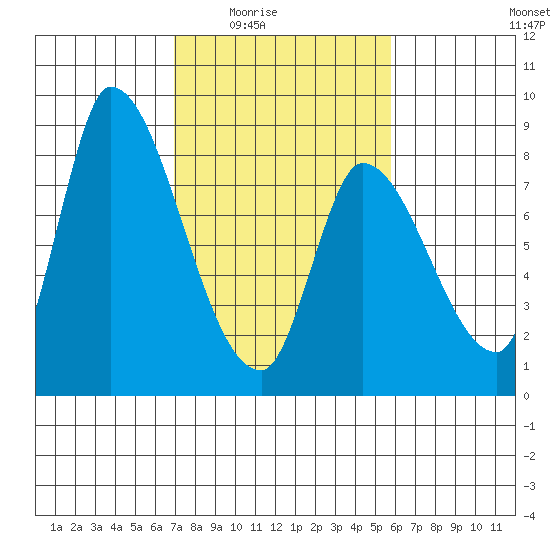
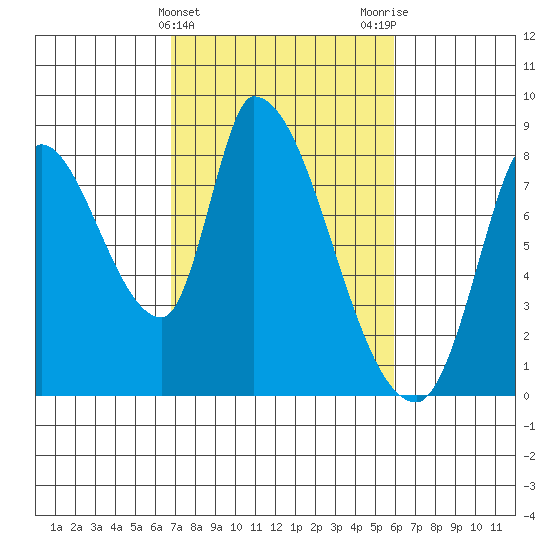
Gold Street Bridge Tide Chart for (Fri) February 16, 2024
Gold Street Bridge
tides for Feb 16th,
the sunrise is 6:56am-5:48pm
and the tide times are H 5:16am 10'2" L 1:42pm 0'4" H 7:32pm 6'6" .
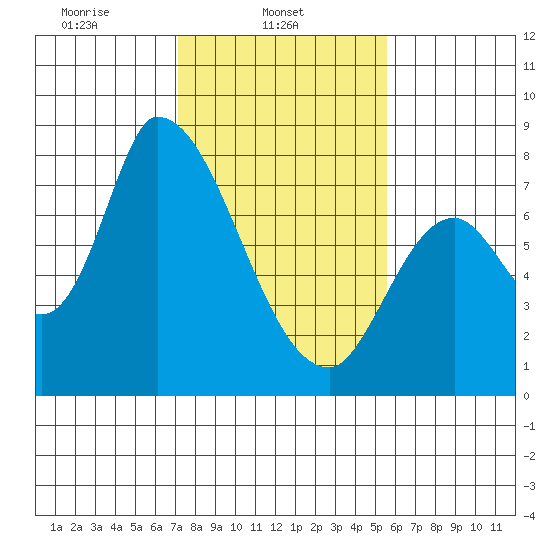
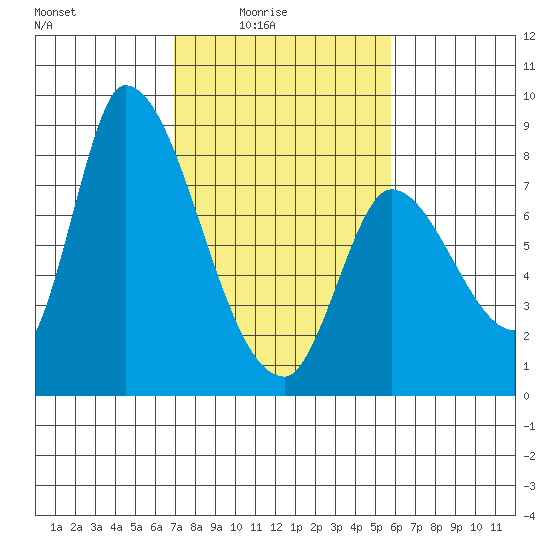
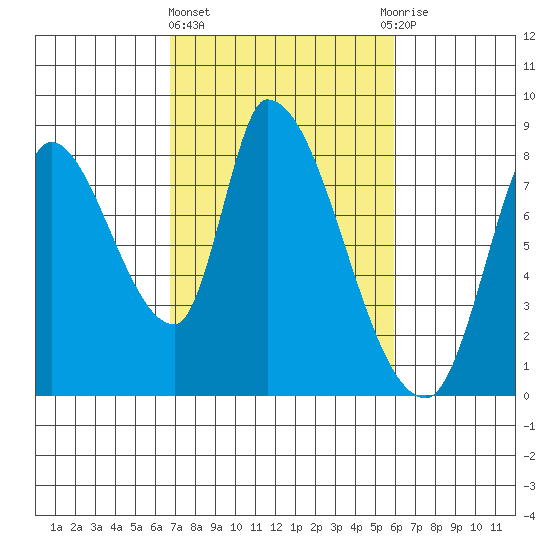
Gold Street Bridge Tide Chart for (Sat) February 17, 2024
Gold Street Bridge
tides for Feb 17th,
the sunrise is 6:54am-5:49pm
and the tide times are L 1:01am 2'9" H 6:12am 10'0" L 2:58pm 0'2" H 9:08pm 6'11" .
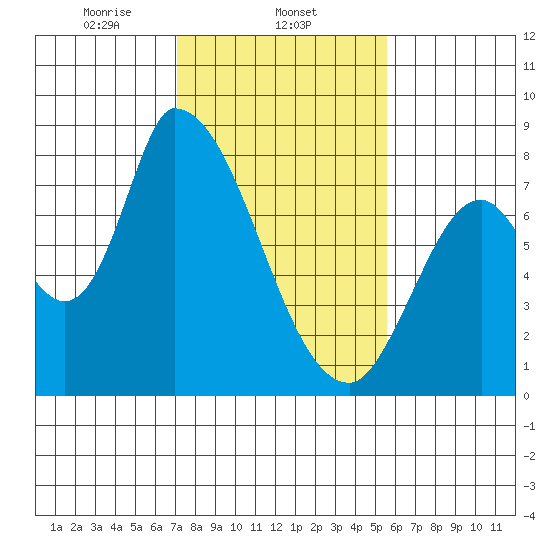
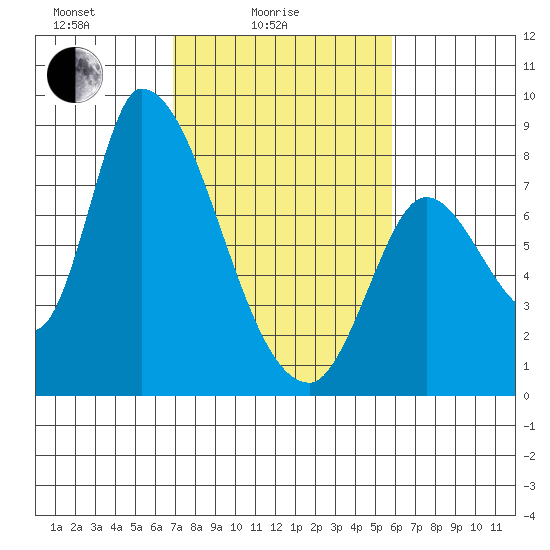
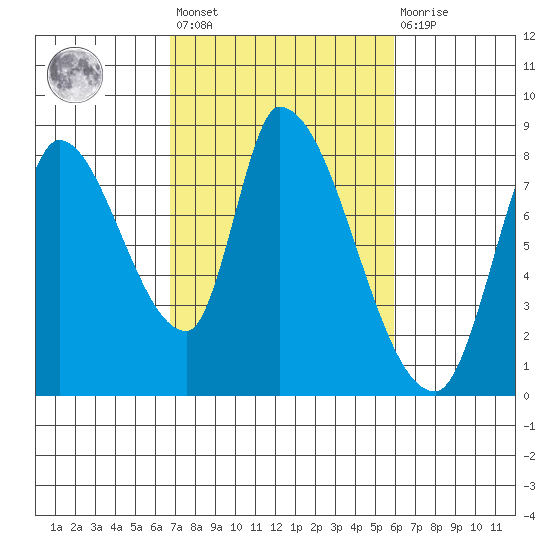
Gold Street Bridge Tide Chart for (Sun) February 18, 2024
Gold Street Bridge
tides for Feb 18th,
the sunrise is 6:53am-5:50pm
and the tide times are L 2:21am 3'1" H 7:15am 9'10" L 4:07pm -0'0" H 10:15pm 7'5" .
Gold Street Bridge Tide Chart for (Mon) February 19, 2024
Gold Street Bridge
tides for Feb 19th,
the sunrise is 6:52am-5:51pm
and the tide times are L 3:39am 3'1" H 8:19am 9'9" L 5:04pm -0'2" H 11:04pm 7'10" .
Gold Street Bridge Tide Chart for (Tue) February 20, 2024
Gold Street Bridge
tides for Feb 20th,
the sunrise is 6:51am-5:52pm
and the tide times are L 4:43am 3'0" H 9:18am 9'10" L 5:50pm -0'3" H 11:44pm 8'2" .
Gold Street Bridge Tide Chart for (Wed) February 21, 2024
Gold Street Bridge
tides for Feb 21st,
the sunrise is 6:50am-5:53pm
and the tide times are L 5:35am 2'9" H 10:09am 9'11" L 6:29pm -0'3" .
Gold Street Bridge Tide Chart for (Thu) February 22, 2024
Gold Street Bridge
tides for Feb 22nd,
the sunrise is 6:48am-5:54pm
and the tide times are H 12:17am 8'4" L 6:18am 2'6" H 10:54am 9'11" L 7:02pm -0'2" .
Gold Street Bridge Tide Chart for (Fri) February 23, 2024
Gold Street Bridge
tides for Feb 23rd,
the sunrise is 6:47am-5:55pm
and the tide times are H 12:46am 8'5" L 6:57am 2'4" H 11:34am 9'10" L 7:31pm -0'1" .
Gold Street Bridge Tide Chart for (Sat) February 24, 2024
Gold Street Bridge
tides for Feb 24th,
the sunrise is 6:46am-5:56pm
and the tide times are H 1:11am 8'5" L 7:33am 2'1" H 12:11pm 9'7" L 7:59pm 0'1" .
Gold Street Bridge Tide Chart for (Sun) February 25, 2024
Gold Street Bridge
tides for Feb 25th,
the sunrise is 6:44am-5:57pm
and the tide times are H 1:33am 8'6" L 8:07am 1'10" H 12:47pm 9'2" L 8:25pm 0'4" .
Gold Street Bridge Tide Chart for (Mon) February 26, 2024
Gold Street Bridge
tides for Feb 26th,
the sunrise is 6:43am-5:58pm
and the tide times are H 1:54am 8'8" L 8:42am 1'8" H 1:25pm 8'8" L 8:50pm 0'8" .
Gold Street Bridge Tide Chart for (Tue) February 27, 2024
Gold Street Bridge
tides for Feb 27th,
the sunrise is 6:42am-5:59pm
and the tide times are H 2:15am 8'9" L 9:19am 1'5" H 2:05pm 8'0" L 9:16pm 1'1" .
Gold Street Bridge Tide Chart for (Wed) February 28, 2024
Gold Street Bridge
tides for Feb 28th,
the sunrise is 6:40am-6:00pm
and the tide times are H 2:39am 8'11" L 9:59am 1'3" H 2:50pm 7'4" L 9:42pm 1'7" .
Gold Street Bridge Tide Chart for (Thu) February 29, 2024
Gold Street Bridge
tides for Feb 29th,
the sunrise is 6:39am-6:01pm
and the tide times are H 3:05am 9'0" L 10:43am 1'1" H 3:45pm 6'7" L 10:11pm 2'1" .